The SEO Dashboard provides a single view for looking at your site’s search performance.
It can be paired with Google Analytics and Google Search Console to bring your real-time data to Semrush.
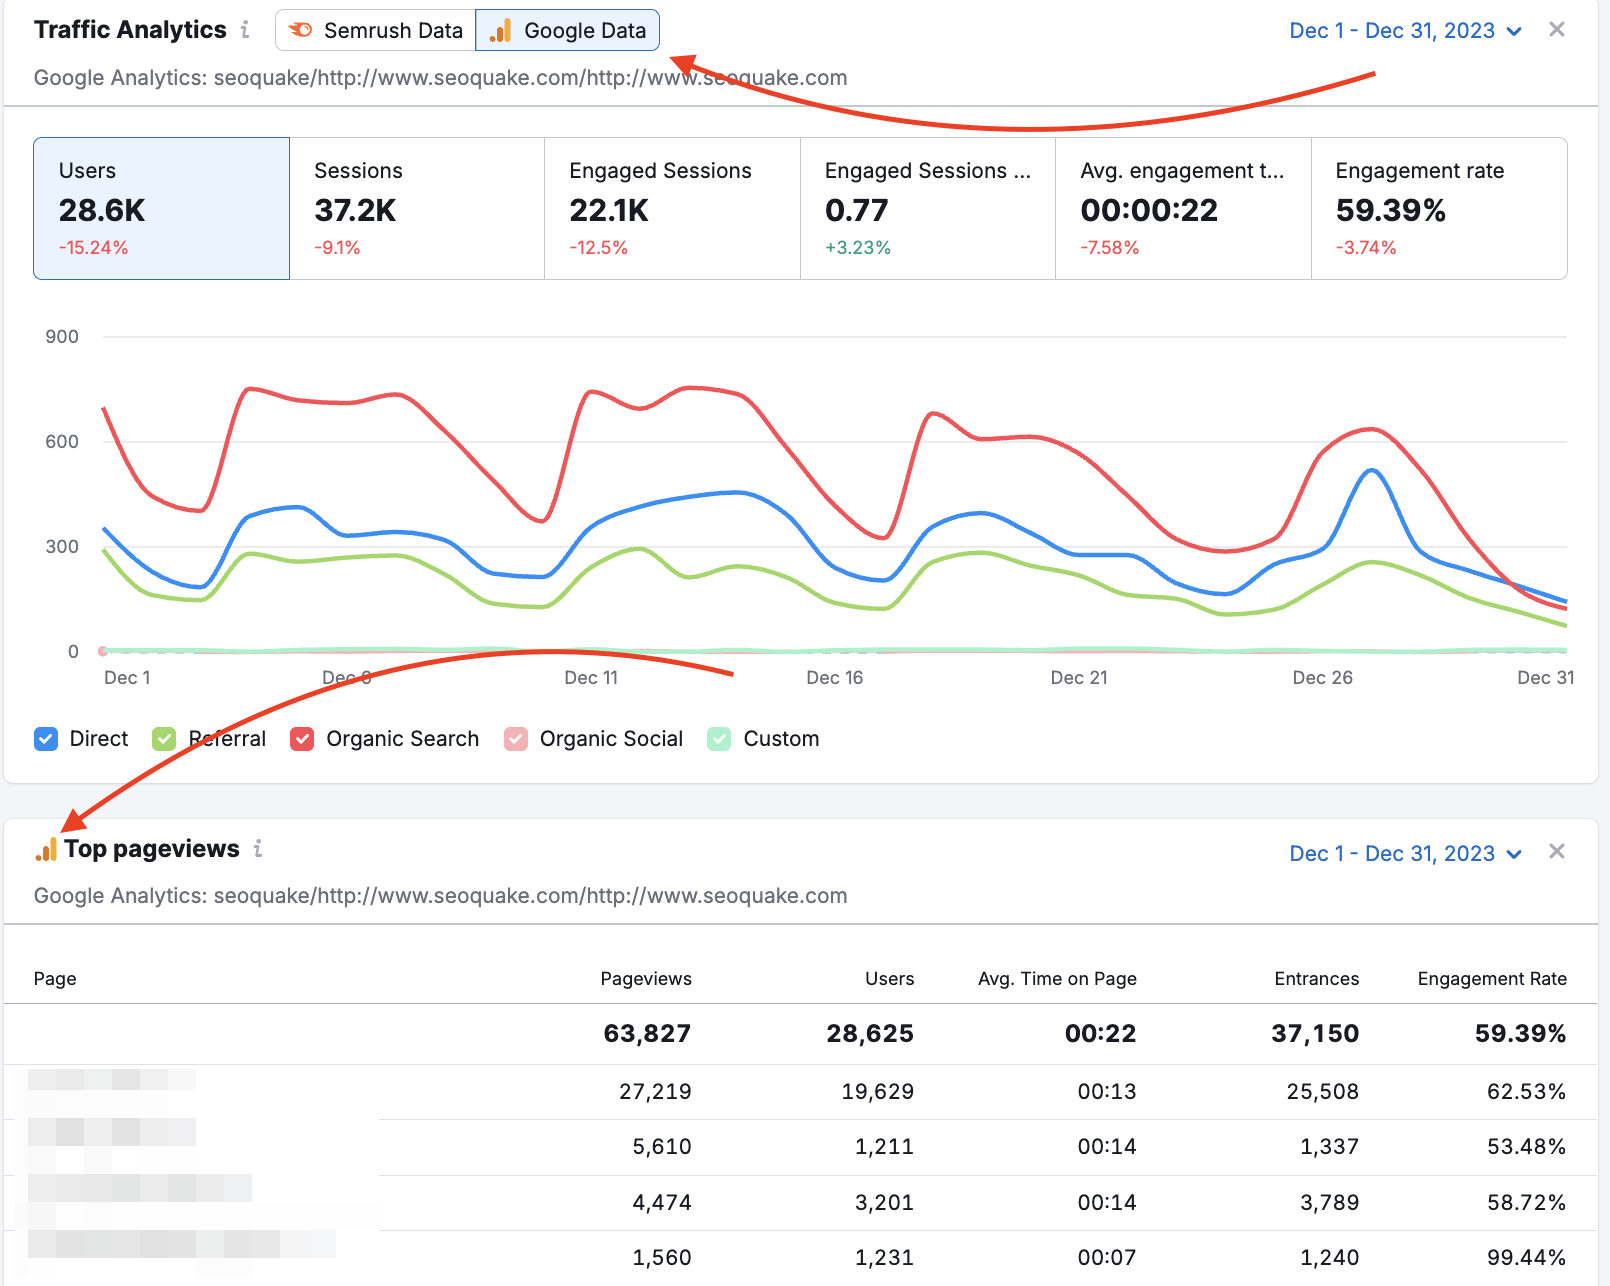
The Google Analytics connection will add the following GA data to your SEO Dashboard:
- Users
- Sessions
- Engaged sessions
- Avg. Engagement time
- Engaged Sessions per User
- Engagement Rate
- A line graph to view trends of top-level metrics (users, sessions, engagement rate, etc)
- Custom channel grouping as a line graph field
The Google Search Console connection will add the following GSC data to your SEO Dashboard:
- Top queries by the number of clicks
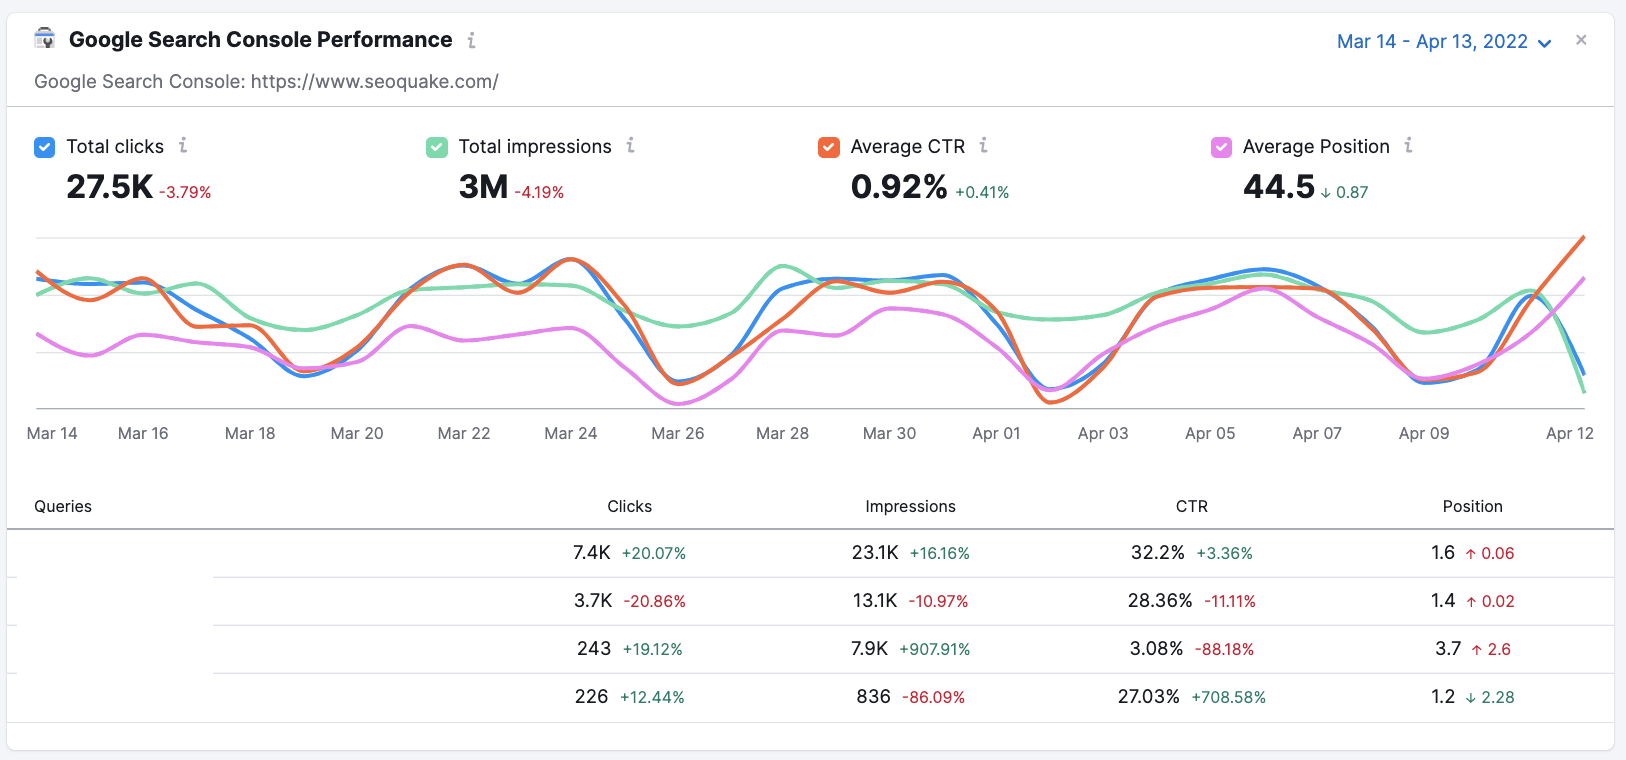
- A line graph of total clicks, impressions, average CTR, and average position
How to add Google Analytics and GSC data to SEO Dashboard
Connecting your GA and GSC accounts to your SEO Dashboard is simple and easy.
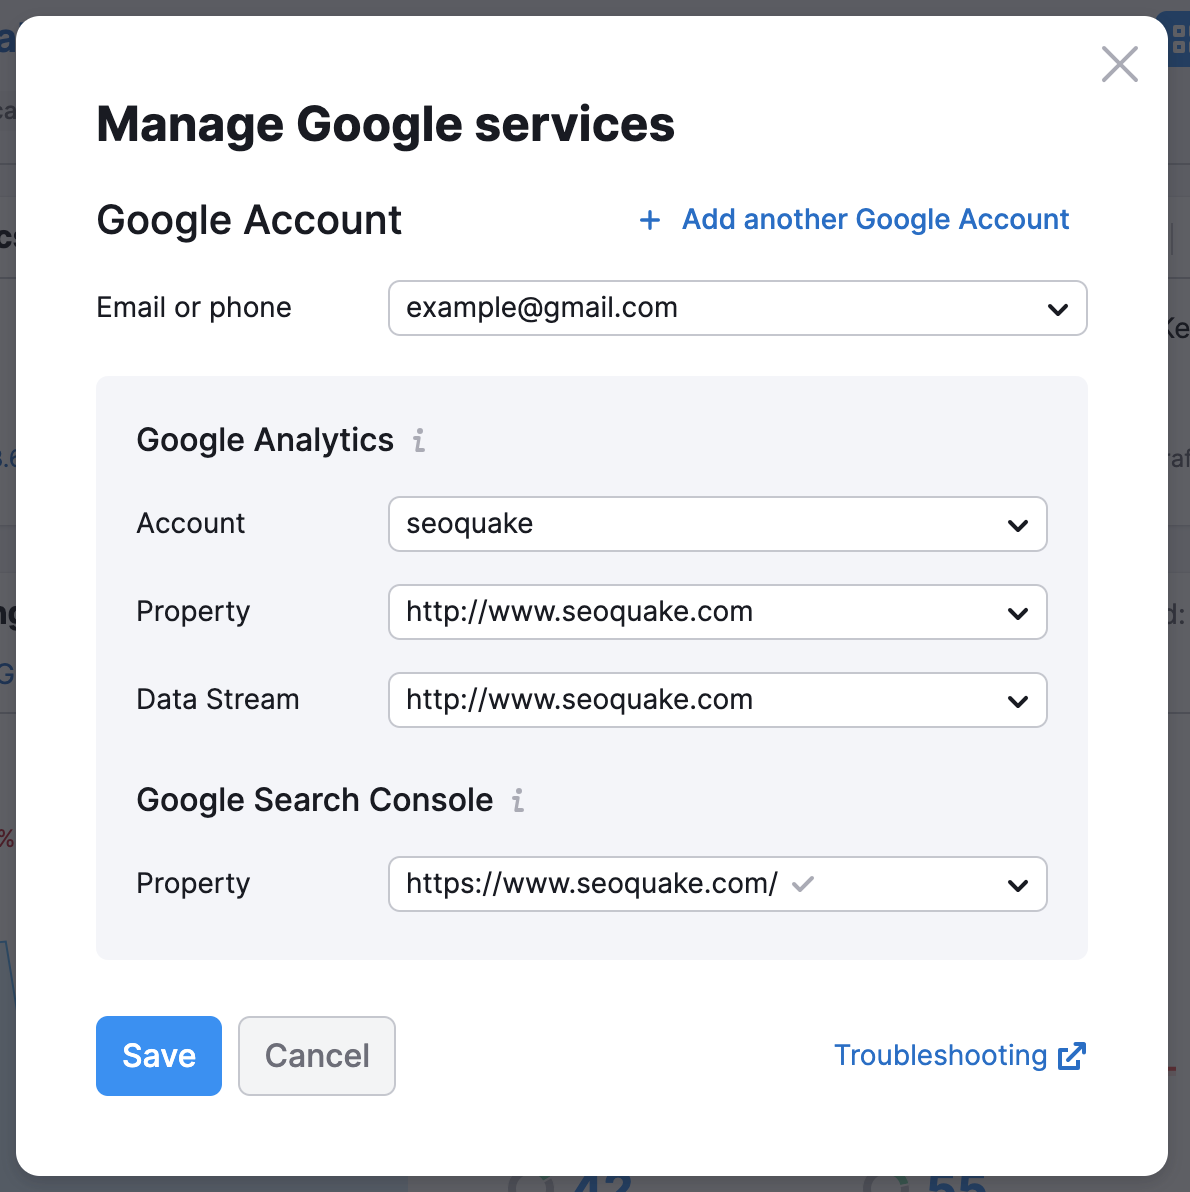
Click on the settings gear in the top right corner of your dashboard. Then click on Google account settings and choose the GA and GSC properties that you want to add to this dashboard.

Please note that only GA4 properties are supported:

You can tell that your data is coming from Google Analytics by the folder icon next to the widget.

Once Google Search Console is connected, you’ll see your website's total clicks, total impressions, average CTR, and average position. You can see all of this data in an interactive graph.

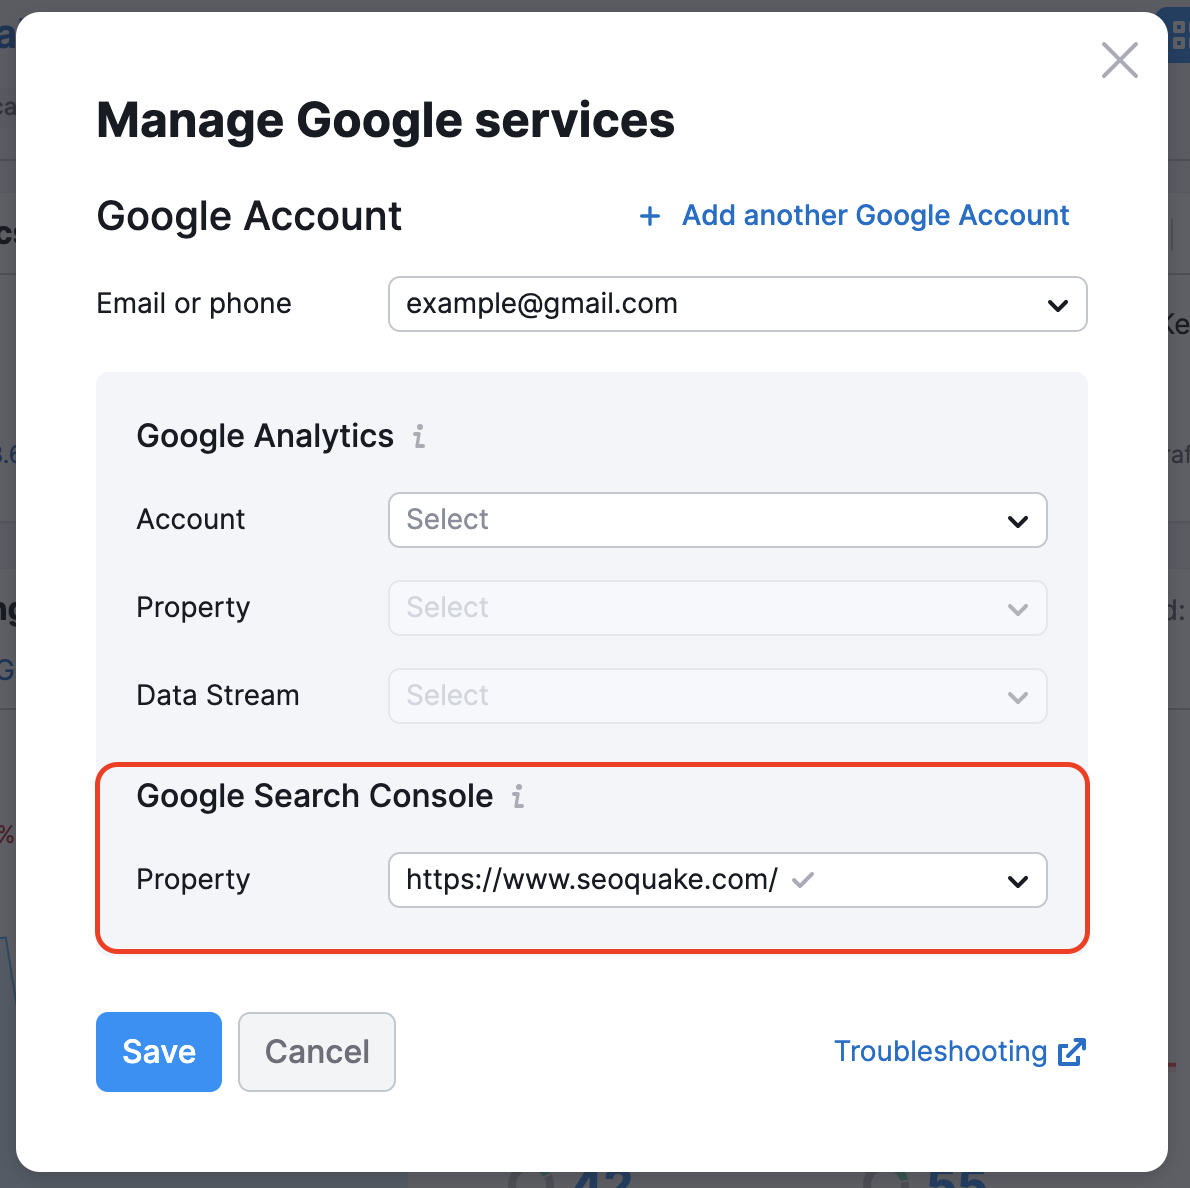
It’s also possible to connect only Google Search Console if you don’t have Google Analytics. Please select your Search Console account in the settings:

In this case, you will be able to see data in the Google Search Console Performance widget.
Keep in mind, Semrush will never store data from a connected Google Analytics or Google Search Console account. The sole reason for allowing you to connect your Google accounts to Semrush is for your convenience.